Risk happens fast. Or does it? We believe risk is always present, it just rears its ugly head at different times for investors.
Stocks finished last week with one of the largest weekly drawdowns since April. The S&P 500 sold off more than 2% while the tech-heavy Nasdaq gave up more than 3% in five trading sessions, from July 29 to August 2. On Monday, the weakness continued with the S&P 500 losing more than 3%. Tuesday showed signs of relief as stocks managed to stabilize on the open of trading.
We’ve all lived through this type of volatility in the past. You hired Napatree Capital to set you on a course for the next five, ten, twenty plus years and if that plan is sound, that should not change with a few sessions of weakness.
How did we get here?
A confluence of factors has sparked this wave of selling.
1) Japan
The Japanese stock market is down 15% since last Monday and 22% since July 11. On July 31, the Bank of Japan raised interest rates to strengthen its currency, the Yen. The tactic worked and the Yen strengthened vs the US Dollar. Why is this important to investors in the US? For nearly 30 years, Japan has kept interest rates close to 0. Consequently, Japanese investors borrowed in Japan and invested in the US. As interest rates rose last week and the Yen strengthened, those investors started to sell US assets to unwind that trade. It is estimated that Japanese investors own about $2 trillion worth of US stocks, which is approximately 4%-5% of the total value of the S&P 500.
2) Nvidia, Large Cap Tech, and Artificial Intelligence
In April we published a note outlining the concerns of a narrow-led market. Fewer than a dozen stocks in the S&P 500 were having an outsized effect on market moves. Why? The larger the company in terms of valuation, the more meaningful it is. Nvidia, the semiconductor manufacturer squarely in the eye of the AI boom, had reached a total value of $3.3 trillion by mid-June, which was equal in size to both Microsoft and Apple. The three companies had a value of roughly $10 trillion, or more than 20% of the entire S&P which has 500 constituents. The last time a market was dominated by only a handful of stocks was in late 1999, early 2000, prior to the dot com bust. Does this portend significantly more downside for the tech-heavy Nasdaq? We have no way of knowing, but the exuberance toward those AI stocks reached an extreme, which is unhealthy, and often leads to a correction.
3) The Fed
Until Friday, the stock market cheered economic data that was a little bit soft. The rationale was that the Fed would cut rates as inflation showed signs of easing and the economy cooled; investors assumed lower rates would support higher stock prices. The Friday jobs report was weaker than expected, which added to recessionary fears, and likely contributing to the selloff in stock prices. We tend to believe that the data was more coincidental in nature and less of a market driver, but the Fed actions as it relates to interest rates are important, nonetheless, as the economy enters the late stages of economic expansion.
4) Seasonality
Late Summer into early Fall is often the weakest periods for the stock market. Many Wall Street folks are still summering, and liquidity is not as robust, which means prices tend to be more volatile. The good news is that the fourth quarter tends to be positive – October is the second strongest month for stock prices after July – and election years into the first year of a presidency have a positive bias for stocks.
5) Apple
It was announced last Saturday (intentionally while markets were closed, we suspect) that Warren Buffett, one of the largest investors in Apple, cut his stake by 50%. Moves in the price of Apple stock, because of its size (see bullet point 2), have a significant impact on overall moves in the S&P 500. Apple is down approximately 7% since the close of trading last Friday.
Going forward…
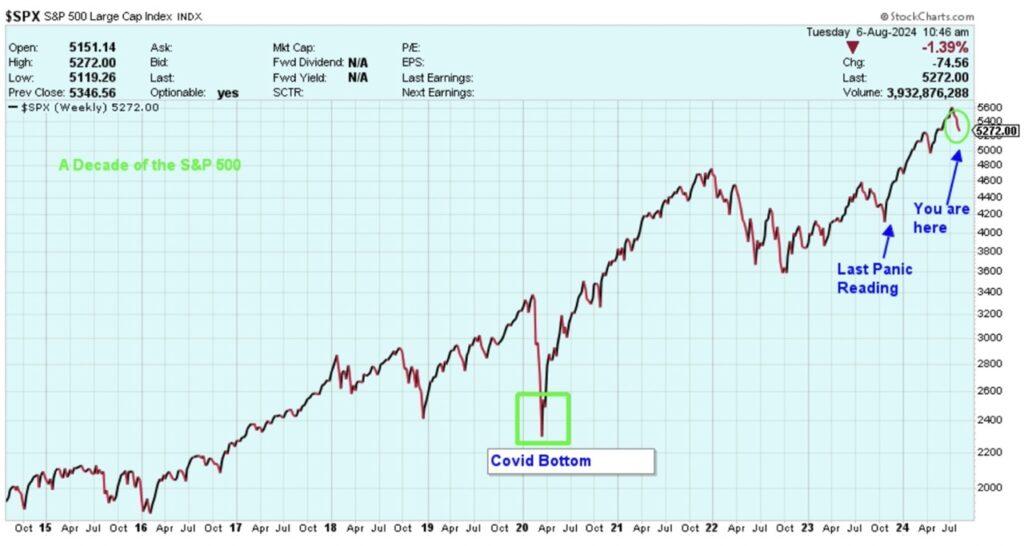
Just as optimism reaches an extreme, the same is true for pessimism, or panic. Thankfully, there is significant research dedicated to measuring investor sentiment. Remember, how investors feel tends to be a contrarian indicator – too much comfort is bad, too much unease is good. One gauge that we monitor, among several, is the Goldman Sachs Panic Index, which accumulates a variety of data to measure bullishness vs bearishness of market participants. That index registered an extreme in October of 2023, signaling panic among investors. From November 2023 to June 30, 2024 (prior to this volatility), the S&P 500 was up almost 29%. That gauge hit an even deeper extreme reading of panic on Monday.
We don’t make predictions, but we do look for opportunity. If you’ve been a client of ours for some time, you know we always have an eye on risk. It allows us to take advantage of opportunity when it arises, and today’s market is no different than past volatile markets. To illustrate this recent move in stock prices in a broader context, we offer the following chart:
And finally, in 2023, Kiplinger, a well-known personal finance publication wrote “Since the 1950s, the S&P 500 has experienced around 38 market corrections. A market correction is considered to be a decline of 10% or more from the recent closing high. That means that historically speaking, the S&P 500 has experienced a correction every 1.84 years. It would not be out of line to have the expectation that the market could correct every two years or so.” If we don’t expect the risk, we can’t expect – or appreciate – the reward.