How challenging was 2022 for investors in the US? Stocks and bonds have not produced negative returns of this magnitude, in the same calendar year, for more than fifty years. The closest parallel to the previous twelve months is the late 1960s/early 1970s, because the volatility is almost entirely due to inflation. That was a time that saw stock prices slide and interest rates rise, as the economy was faced with persistent inflation and the Federal Reserve bank acted similarly to today.
History Lesson
From January 1966 to August 1969, the Fed Funds Rate – an overnight rate that banks charge each other for lending purposes, which is set by the Federal Reserve Open Market Committee (FOMC)– more than doubled from 4.5% to 10.25%, in what was then seen as aggressive action by the Fed to tame inflation. In August 1969, The Fed started easing by cutting interest rates as the economy slowed and the country faced increasing job losses. Following its mandate to keep inflation low and employment high, went from raising to easing interest rates, moving the effective rate back to about 5% in March 1971. But the story doesn’t end there. Inflation was persistent even with a slowing economy because of a burgeoning energy crisis. Once again, the Fed moved to a tightening stance, this time increasing interest rates by more than 300% from the Spring of 1971 to the summer of 1973. Interest rates skyrocketed and stocks suffered badly, declining by more than 40% in the 14 months following the start of that “new” tightening cycle, before bottoming in October 1974.
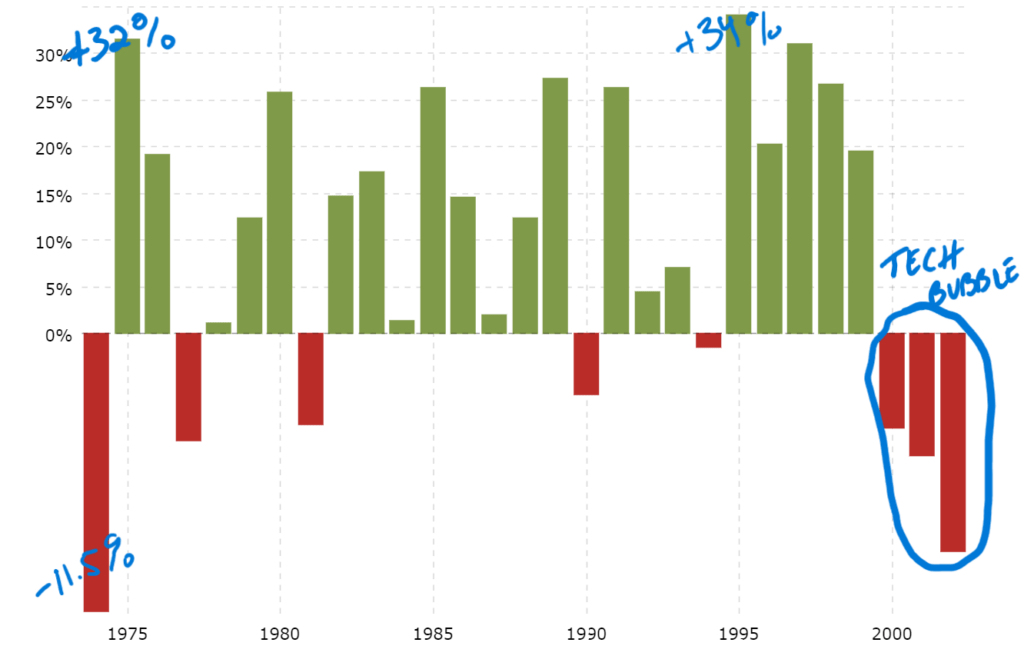
Interestingly, interest rates remained historically elevated throughout the 1980s, but stocks managed to do quite well. From the low in October 1974, the S&P 500 had an impressive run until the tech meltdown in 2001, appreciating 460% into late 2000. The data is compelling, as seen on this graph.
Following the Fed pause in 1974, 21 of the subsequent 28 years leading up to the tech bubble, stocks generated a positive annual return. The worst year was 1977, when the S&P was down 11.5%, and the best year was 1995 when the S&P 500 generated a positive 34% return. There were eight years in that three decades stretch when stocks increased by more than 25%!
Battling inflation in the 1970s contain some lessons applicable to today’s Fed with potential implications for both stock and bond markets. Because of the spike in consumer demand coming out of the pandemic, combined with bottlenecks in the supply chain which constrained availability on everything from diapers to semiconductors, consumer prices rose substantially. As a result, the Fed has acted with determination to control the largest increase in inflation in half a century by raising the Fed Funds rate.
How does it compare? Prices of financial assets dropped drastically in 2022. Both bond and stock markets suffered high double-digit losses, an extremely rare investment dynamic. Using the total return on a 10 Year US Treasury bond as a proxy for the bond market, there has only been one other year since 1960 when bonds had a decline in value of more than 10%, and that was in 2009; the stock market appreciated almost 26% that year, however, as the country emerged the 2008 crisis.
Even in the hyper inflationary period of 1973 and 1974, where stock prices slid 14% and 25% respectively, bonds offered a margin of safety, appreciating 7% and 7.8% in those consecutive years. Using that era as its playbook, the Fed, led by chair Jerome Powell, has been candid with investors. The FOMC will continue to hike rates until inflation is under control. The five-year period from 1969-1974, when the Fed backed off from continued interest rate hikes, only to have to switch gears soon after, proved to be a mistake. We believe that is Powell’s biggest fear.
To put in perspective: the Fed Funds rate increased from 2.25% to a peak of 14.3% from February 1971 to July 1974, a total increase of about 230%, a slow and steady move higher in that forty-month period. Beginning in March of last year, the Fed raised rates from 0.08% to 4.3%. That may seem milder as the overall level of interest rates is still historically low, but consider the Fed took this action in nine months, increasing rates by 5300%!
It is safe to say that 2022 was unprecedented.
When Diversification is Broken
Often, the bond portion of your portfolio provides ballast during periods of volatility in stock prices. It is not a pure inverse relationship with prices of bonds strengthening when prices of stocks fall, but historically, bonds have served as a hedge against large sell offs in stocks. Not so in the past year and a half.
Below is the performance of select indexes for the past 12 and 18 months:
| Index | 2022 | Last 18 Months |
| S&P 500 | -18.1% | -5.8% |
| Dow Jones | -7.3% | -1.0% |
| NASDAQ Comp | -32.5% | -18.9% |
| MSCI ACWI (All World) | -18.0% | -9.0% |
| Russell 1000 Value | -7.5% | -0.8% |
| Russell 1000 Growth | -29.1% | -13.8% |
| Bloomberg US Agg (Bonds) | -13.0% | -13.0% |
| Bloomberg Global Agg (Global Bonds) | -16.3% | -17.6% |
| 60/40 Portfolio | -16.1% | -8.6% |
There are several ways to diversify risk in an investment portfolio. Most money managers begin with a simple allocation to stocks, bonds, and cash. Within stocks and bonds, limiting concentration risk (no positions too large), geographic risk (US, Europe, Asia, etc.), or style risk (i.e., value stocks vs growth stocks) are examples of further diversification. Almost none of these risk mitigation methods were effective last year.
Highlighted in yellow above is the synthetic return of the classic “60/40” portfolio, 60% in stocks, 40% in bonds. Blackrock, one of the largest institutional money managers in the world, recently published a note titled, “Rebuilding Resilience in 60/40 portfolios”. Classic portfolio management theory says that an investment account which allocates 60% in stocks and the balance in bonds should be able to weather volatile markets and generate an annualized return around 5%-7% over time. That was not the case last year as both the bond and stock markets endured losses of 13% and 18% respectively; the 60/40 portfolio lost approximately 16% in 2022.
In the Fall of 2021, our investment committee made the decision to look for alternative funds for our client portfolios. We felt that extreme valuations in certain sectors of the equity market coming off the COVID boom, and an inflationary macro-economic environment, was the setup for volatility in both stock and bond markets. To be clear, we don’t like to prognosticate and did not foresee the extreme that occurred in financial markets. But we felt strongly that we needed to allocate a portion of client assets to investments which had returns that were not highly correlated to returns in stocks or bonds. In other words, we asked ourselves a simple question, “what will help our clients if both of those financial markets offer little in the way of return.”
We identified two strategies which when combined, offered consistent income as well as a direct hedge against stock market volatility, and allocated to client portfolios.
Blackrock’s note encouraged investors to think differently in the wake of last year’s volatility, suggesting a potential sea change in the investment landscape and, interestingly, introduced the concept of alternative investments in portfolios. Maybe they were listening in to our investment committee meeting in October 2021!
Our Moderate Growth portfolio, which targets between 60%-70% in stocks and the balance in bonds, performed significantly better than a synthetic portfolio (referenced above) because of the two alternative funds selected by our investment committee. For 2022, that portfolio returned approximately -12%, beating the S&P 500, the US Bond Index, and the “60/40” portfolio.
The Value of Predictions
Every year analysts/economists/strategists produce year-end targets for the stock market. Consensus estimates for the closing value of the S&P 500 in 2022, among Wall Street firms, was roughly 4800, with the higher end closer to 5200. The index closed the year at 3840. Meaning expert strategists at the top investment banks and research firms in the world, over estimated returns for stocks last year by 20%. The point here is twofold: investing is a difficult, ongoing process with a changing landscape and predictions should be used for entertainment purposes only.
If you ask our opinion on the market’s direction, we will generally have one. But our focus is managing risk, growing your wealth always with an eye on preservation. We remain disciplined in our investment approach: we look for periods of “over adjustment” by the stock market, marked by extremes in sentiment – positive or negative – and act accordingly. Buying on weakness and selling into strength.
Since Napatree Capital’s founding in April 2018, stocks endured a sharp drawdown of about 15% from October to December 2018, a vigorous recovery in 2019, a COVID meltdown and incredible rally in 2020 which continued into 2021. But the rally took on bubble-like behavior in certain technology stocks, crypto, and – a newly minted phrase coming out of the pandemic – “meme stocks”, such as GameStop (see our note titled “The GameStop Frenzy” found here), setting up for a brutal 2022. A wild ride, for sure. That experience reaffirms our beliefs in ignoring the day-to-day noise of market commentary, a commitment to our own ideas backed by our own research, avoiding the herd mentality, and a focus on investing today for positive, long-term results.
Maybe the bubbles that have burst, taking down speculators and short-term traders, and the actions by the Federal Reserve to maintain a healthy economy, combined with extreme pessimism by investors will prove to be the foundation of another period of steady market returns like the thirty-year period described above. It is doubtful investors felt very confident in their portfolios in the 1970s, but those that stayed the course were handsomely rewarded.
1 https://www.macrotrends.net/2526/sp-500-historical-annual-returns2 60% of the ACWI and 40% of US Agg
3 https://www.blackrock.com/sg/en/insights/60-40-portfolios-and-alternatives
4 As measured by the Bloomberg US Agg and S&P 500
5 Not all portfolios are invested in alternative funds. It depends upon the client objective and allocation which differs among portfolios due to customization.
6 Napatree Moderate Growth portfolio objective has a target of 65% in equities, 23% in bonds, 12% in alternatives
7 https://napatreecapital.com/category/viewpoints/
Napatree Capital LLC (“Napatree Capital”) is an SEC Registered Investment Advisor (“RIA”). Napatree Capital provides investment advisory and related services for clients nationally. Napatree Capital will maintain all applicable registration and licenses as required by the various states in which Napatree Capital conducts business, as applicable. Napatree Capital renders individualized responses to persons in a particular state only after complying with all regulatory requirements, or pursuant to an applicable state exemption or exclusion.
Different types of investments involve varying degrees of risk. Therefore, it should not be assumed that future performance of any specific investment or investment strategy will be profitable. Past performance is not an indication of future results.