It is the ideal term for the current market environment. It seems as though each time markets attempt an advance, the bottom falls out. Maybe it really is difficult to time these things…
Since our last note in the third week of June, where we highlighted extreme bearishness among investors, stocks rallied almost 18% into mid-August, before conditions became rocky once again. The deep sell off in stocks on Tuesday, September 13, has been attributed to the monthly release of the Consumer Price Index (CPI), the best gauge of tracking inflation. Economists were expecting a drop of 0.10% and prices increased 0.10%, a difference of 20 basis points, or 2/10ths of 1%.
As of today, the S&P 500 is still about 7% above the lows it made in June, but down roughly 17% for the year. Why the volatility and where do we go from here? Our reasoning follows.
Inflation…
Inflation is the single biggest influence on financial markets this year. We’ve seen prices for gas, food, construction materials, even healthcare, increase dramatically in the past twelve months. Causes for inflation are not complex: either a tight labor market which drives wages higher and leads to increased consumer spending, or a weakening of the US dollar against other currencies. The US is enjoying a strong economy and spending by consumers has not slowed. Personal incomes are up 5.2% in 2022 and almost 18% in the past three years (through July 31). The combination of massive economic stimulus and the inability to manufacture and transport many goods due to conditions from the pandemic ignited the economy and sparked inflation. The conditions are not unexpected and part of an economic cycle. But the rate of change in labor markets – unemployment rate went from a high of 14% during the depths of the pandemic to 3.6% today – is unusual. The good news is that inflation today is the byproduct of an incredibly robust economy. The bad news is how rapidly it developed.
the Fed…
The Federal Reserve Bank has a mandate to control inflation. Raising the fed funds rate, which is the overnight rate at which banks borrow money from the Fed, allows central bankers to slow an economy from overheating. This action generally causes all interest rates to move higher, thus making borrowing more expensive. Some economists argue the Fed is behind and must act more aggressively, which could cause greater economic pain than necessary.
The selloff in stock prices is reflecting that stance.
…and Bonds
The bond market hates inflation. As interest rates rise, bond prices go lower. Since mid-1981, bond prices have moved steadily higher as interest rates have gone steadily lower. It has been a 40-year bull market. Could this be the beginning of the end for that bull market? Perhaps. Because of inflation and actions by the Fed, the fixed income markets have offered no safe haven in 2022, with the broad index down roughly 13%.
Interestingly, prices of bonds and stocks have been largely moving in the same direction, which happens during periods of higher inflation. Stabilization in the fixed income markets might be the key to a recovery in stocks.
Data We’re Watching
What is relevant and what may hold the key to stabilization in financial markets:
Energy/Commodities
The energy sector has been the best performing sector in 2022, up nearly 50% year-to-date (using Energy Select SPDR ETF as a proxy). The sector hit a peak on June 8th, the stock market bottomed six trading days later, and the S&P 500 has slightly outperformed energy stocks since then. The inflation data released on Tuesday showed energy prices down for the second consecutive month. This is an important relationship to watch.
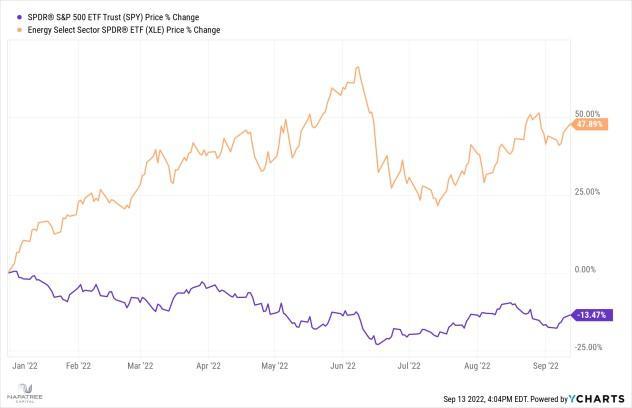
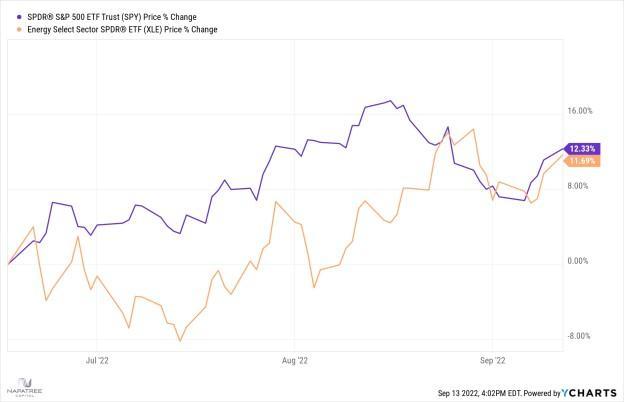
Not sure if this relationship is meaningful? The price of Exxon Mobil (XOM) stock is up nearly 65% year to date while the price of Apple (AAPL) stock is down about 7% in that same time frame. Since the June 18th low, AAPL stock has appreciated 11% with XOM stock down 5%. Representing two very different sectors, AAPL is the largest member of the S&P 500 and XOM the 9th largest. We think smart investors are beginning to trim gains in energy stocks and exposure to commodities in general which could be signaling inflation has peaked (or is close).
US Treasury Market
Treasury bills that mature in under a year have become extremely attractive from an investment standpoint. The yield of a 12-month treasury is currently about 3.6%. One year ago, that yield was about 0.10%. What does this mean?
- Investors can secure a 12 month return of 3.6% in a financial market, effectively risk-free. The US treasury market is the most liquid and safest in the world. And the huge jump in rates is due to inflation and actions by the Fed.
- With inflation running at about an 8% rate annually, your real return is actually negative; 3.6-8 = -4.4, if inflation persists. More on this data point later.
Market Sentiment
Investor sentiment is heavily skewed toward bearishness right now. Remember, this is a contrarian indicator. Historically, stock markets bottom on extremes in fear and top on extremes in greed. How is sentiment
measured? There is a multitude of historically reliable data which we monitor but here are three that are compelling:
- The amount of “insurance” being paid by large, institutional money managers is at an alarming level. The amount of put options being bought today is the most ever since the data has been tracked. Put options are derivative financial instruments that bet on lower prices and can be used to hedge against further downside in most assets. The level of put insurance against continued weakness in stocks should not be ignored. Again, as contrarians we want to avoid the herd, and this data most certainly qualifies as herd mentality.
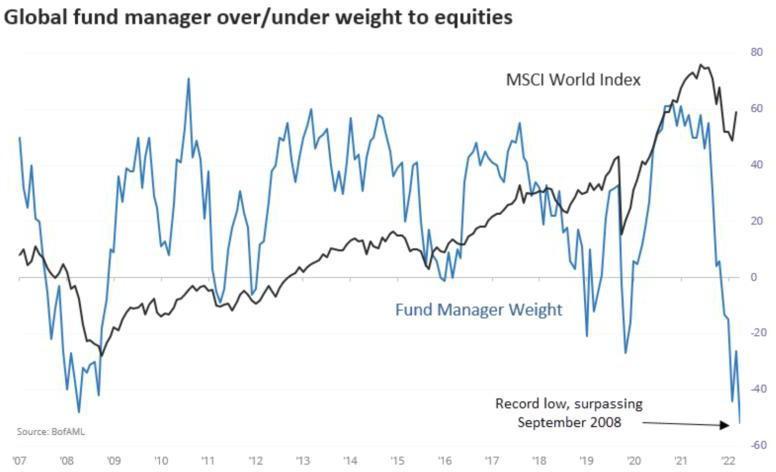
Global fund managers are dramatically underweight stocks, at the lowest level since the Great Financial Crisis. These managers are compensated based on their relative performance to stock market returns which means that if the market were to stage a rally, they would have to “catch up” and increase exposure to stocks rather quickly, pushing stock prices higher. (Chart below courtesy of www.sentimentrader.com)
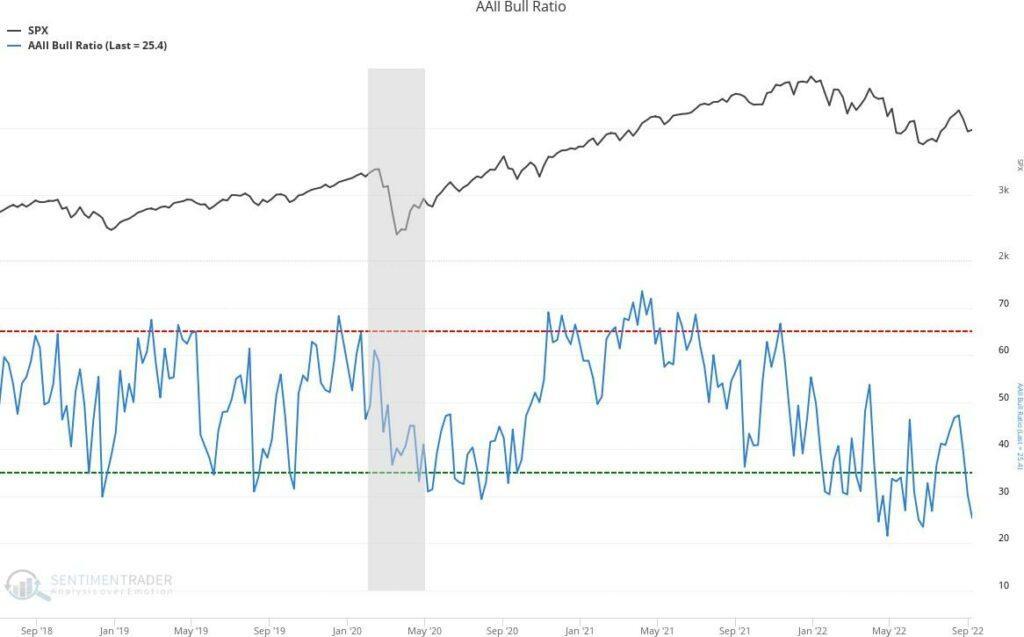
An index (blue line) of bullishness (optimistic, above red line) vs bearishness (pessimistic, below green line) on stocks that is derived from a weekly survey of thousands of individual investors is currently showing an extreme level of bearishness. The current level is even lower than the depths of the Covid market crash. Chart below (black line at the top is the S&P 500, gray bar is recessionary periods):
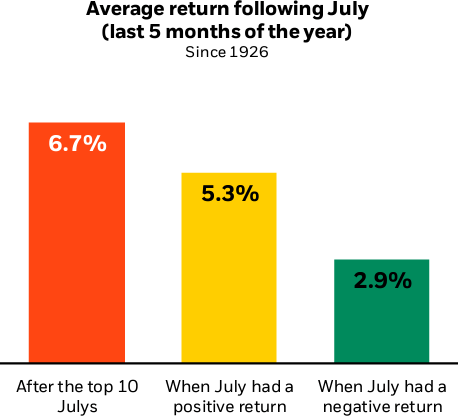
July was the 4th best July ever in the history of the stock market; below illustrates how stocks performed from Aug-Dec following a strong July (courtesy of Morningstar and Blackrock):
From a seasonality standpoint, the stock market is entering a strong period. In the past decade, the 4th quarter of the year is the second-best quarter after the second quarter, with stocks posting a positive return 7.4 out of 10 years on average, or 74% of the time. We see this as a minor plus although seasonality hasn’t helped much in 2022, with the second quarter being by far the weakest, thus not following history. But combined with the July data, a silver lining for stock prices.
What If?
- What if inflation is peaking? The pressure on stocks and bonds is most certainly due to expectations of aggressive Fed tightening amid a strong economy. We think there are signs that continued inflation is priced into the market and that may not be the case.
- What if the commodity markets, specifically energy, are a leading indicator of inflation? Last June the price of a gallon of oil increased at a dramatic rate. Gas prices started to climb but stock prices also continued to move higher, until stocks reversed this past January as inflationary data worsened. The last two CPI reports have shown declines in the price of oil, perhaps an indicator that inflation may start to moderate.
- What if investors are too bearish? Time and again when pessimism is high, stocks bottom. Timing is never perfect, and we think market volatility continues, but with continued volatility comes increased pessimism – the formula for a bottoming process in stock prices.
- What if we avoid a recession? Any recession should be shallow because it should occur due to tightening financial conditions by the Fed and not some type of economic crisis. It is part of an economic cycle. Perhaps we should view the pullback in stocks in 2022 as a necessary adjustment.
It has become a challenge to stay the course in 2022. It requires discipline and a long-term view. Ignore the predictions. Our discipline is to keep you from making a mistake in your investment portfolio from which you won’t be able to recover. We take measured steps, with patience and process, to support that discipline. One of those steps is to rebalance portfolios when stock prices deviate from the intrinsic value of a company, which we are experiencing today. Over the coming weeks you will see increased trading in your account(s) as we rebalance portfolios to keep them properly diversified, in line with your long-term financial objective, and poised to reap the rewards of a stock market rally, somewhere on the horizon.
Please contact us to discuss your personal situation if we haven’t spoken recently.
Napatree Capital LLC (“Napatree Capital”) is an SEC Registered Investment Advisor (“RIA”). Napatree Capital provides investment advisory and related services for clients nationally. Napatree Capital will maintain all applicable registration and licenses as required by the various states in which Napatree Capital conducts business, as applicable. Napatree Capital renders individualized responses to persons in a particular state only after complying with all regulatory requirements, or pursuant to an applicable state exemption or exclusion.
Different types of investments involve varying degrees of risk. Therefore, it should not be assumed that future performance of any specific investment or investment strategy will be profitable. Past performance is not an indication of future results.