The first quarter of 2023 ended with most major stock market averages in positive territory. The tech-heavy NASDAQ led the way with a whopping 16.8% return, which means growth investing has roared back after a miserable 2022 in which the NASDAQ posted a -33% return. The disparity between performance in market averages for the first three months of this year was wide, shown below for selected indices:
Index | First QuarterReturn |
| S&P 500 | 7.1% |
| NASDAQ | 16.8% |
| Dow Jones Industrial Avg | 1.8% |
| Small Cap Index | 2.3% |
| Int’l Developed | 7.7% |
| Int’l Emerging | 3.6% |
| Gold | 8.8% |
The yield on a US 10-Year Treasury bond was 3.7% for the quarter, down slightly from a high of 3.75%. While interest rates have moderated after a volatile 2022, uncertainty in the bond market remains high given the Federal Reserve Bank’s activity. The “ten-year “is often used as a benchmark for the interest rate environment. In the past twelve months ending March 31, as interest rates have climbed, the yield on the ten-year increased 33%. Short-term rates have seen the biggest increase; the yield on a six-month treasury is up 353% in that same time frame, offering investors close to a 5% annualized returni.
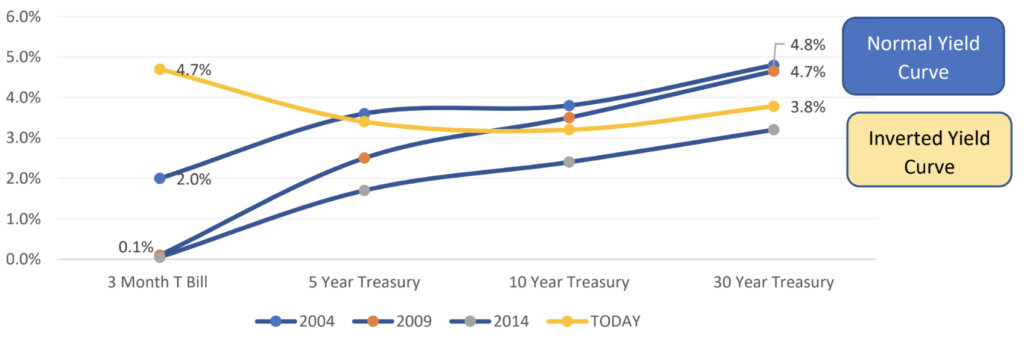
When shorter term interest rates are higher than longer term rates it is called an inversion of the yield curve. Every recession in the US economy has been preceded by an inverted yield curve, yet not every instance of an inverted yield curve has predicted a recession. Shorter term rates have exceeded longer term rates several times in the past 40 years without a contraction in GDP. Below is an illustration of normal yield curves (blue) and the current one (yellow).
Interest Rates for Different Time Periods
(Yield Curves)
Fears of a Recession
What would a recession– defined as two consecutive quarters of negative growth – mean for investors? Assuming the yield curve is a reliable indicator, it takes about 12 months from the point of inversion, on average, for a recession to begin. When the yield curve inverted in August 2019, however, the economy went into a sharp recession only six months later, which was the result of COVID fears and subsequent lockdowns.
The following chart illustrates the number of months between yield curve inversion and the start of a recession going back to 1978:
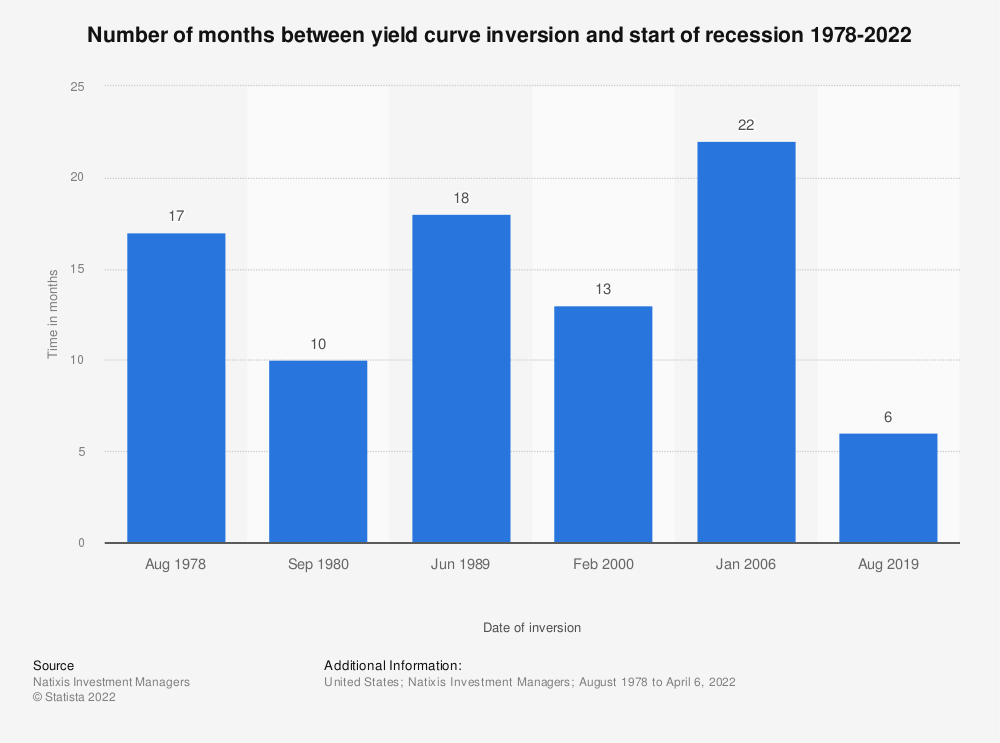
Most recently, shorter term interest rates exceeded longer term rates beginning in October 2022 and the yield curve has remained inverted ever since. According to historical data, a recession could begin sometime between April and October – in other words, right now! As that chart shows, the performance of the stock market (S&P 500) was generally positive following a yield curve inversion, as the economy moved toward a recession.
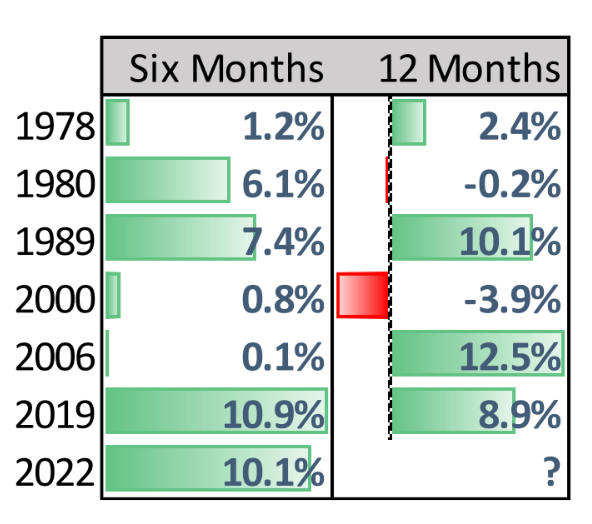
The table to the left shows that six months from the date the yield curve first inverted — and in some instances while the economy plodded through a recession — the stock market (S&P 500) was higher every time. At 12 months out, stocks still managed to perform well with only two years – 1980 and 2000 – exhibiting small losses.
Despite the constant chatter of whether the economy is headed into a recession, investors should be careful to assume that a weaker economy translates to weaker stock prices. Past evidence suggests the contrary.
Real Estate: The Next Crisis?
The cost of borrowing has increased dramatically with rising interest rates. The Housing Affordability Index, published monthly by the National Association of Realtors, showed that at the end of February 2022 a home buyer would use about 24% of her income to finance a house. This is up from a year ago when the cost was less than 20%. Affordability has suffered as mortgage rates have gone up: as of March 31, the rate on a 30-year mortgage was 6.3%, a dramatic increase from 4.2% a year ago.
The rise in interest rates has created another challenging dynamic: a stagnant real estate market. Why? From a recent article in Forbes magazine:
…the nation’s housing supply remains limited. Those who purchased homes in recent years at record-low interest rates are staying put. Tight inventory issues, in part, are also keeping prices from dropping off, which is perpetuating affordability challenges for many, especially first-time homebuyers.
In most supply and demand relationships, strong demand in an asset translates to higher prices (or cost), which pulls in supply as sellers of those assets get more interested. Eventually the increase in supply weakens prices as excess inventory accumulates. But in the current real estate market, an increase in supply would be a healthy and welcome occurrence and could help to support a residential real estate market where there is persistent demand.
In March prices of homes ticked lower from the previous month as interest rates came down from highs in the quarter. At the current sales pace, unsold inventory is hovering just below 3 months, which is up from 1.7 months a year ago, but still extremely low from a historic perspective.
Could this lead to a major crisis or crash in the housing market? Unlikely. Wages are rising and household balance sheets are strong. The last major correction in real estate, 2007-2010, was a completely different scenario. Banks’ lending standards were much more aggressive, allowing for an overleveraged homeowner. As Nicole Bachaud, an economist for Zillow noted, “Homeowner equity is at the highest level it’s been in the past several decades, so homeowners have a lot of value in their home.” Additionally, a drastic decline in sales prices of existing homes and an acceleration in foreclosures typically accompany a residential real estate crash. Neither is happening today.
Our Macroeconomic Take
We are not economists. We pay close attention to data, but it has been proven time and again that economic forecasts are not very useful for investors, especially those with a tilt towards value. In a recent interview, Warren Buffett said that if he adhered to economic forecasts he would be broke.
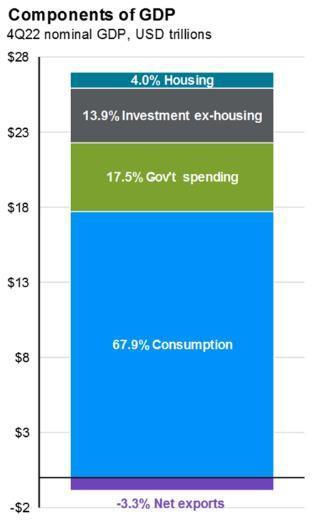
Greater than 2/3rds of the US GDP comes from consumer spending (see chart). The health of the consumer closely tracks the health of the economy. The University of Michigan conducts a monthly survey of 500 US households, asking various questions related to their expectations of spending, inflation, and investing. The May 2022 survey was the most negative in a decade, with only about 50% positive responses, but has since been improving:
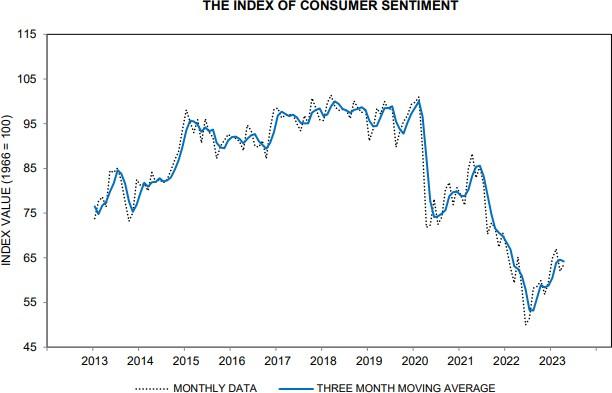
The survey has been a reliable indicator of the direction of the economy, and historically when it hits an extreme low and then rebounds, as in last May and February 2020 prior to that, stocks tend to rally. With savings rates by consumers on the rise, up about 18% from a year ago, household debt as a percentage of income still historically low, and interest rates moderating from a high in October, it is difficult to envision a scenario where the economy weakens drastically. And while the banking crisis has chilled investors’ sentiment, both stocks and bonds have rallied since the collapse of Silicon Valley Bank and Signature Bank in early March.
The financial markets appear to have stabilized from a year ago, though it has not been a comfortable journey. More conservative approaches to investing, like a balanced portfolio of 50% stocks and 50% bonds, still lost about 10% from January of last year to March 31, 2023. The S&P 500, NASDAQ, and the Bloomberg US Aggregate Bond Index are down 12%, 21%, and 10.4% in that time, respectively. But when two major banks fail as a result of interest rate volatility and tightening economic conditions, and stock indexes move higher through the turmoil, it is an indication that markets have already discounted the volatility. Is there another failure on the horizon? Who knows. But crises are not uncommon events. In the decade-plus since the Great Financial Crisis, there have been eight years with intra-year declines greater than 10%, and six years with intra-year declines greater than 15%. The stock market ’s total return in that 13-year period is nearly 380%. If you find yourself saying “this year is different” — it isn’t.
Napatree Capital LLC (“Napatree Capital”) is an SEC Registered Investment Advisor (“RIA”). Napatree Capital provides investment advisory and related services for clients nationally. Napatree Capital will maintain all applicable registration and licenses as required by the various states in which Napatree Capital conducts business, as applicable. Napatree Capital renders individualized responses to persons in a particular state only after complying with all regulatory requirements, or pursuant to an applicable state exemption or exclusion.
Different types of investments involve varying degrees of risk. Therefore, it should not be assumed that future performance of any specific investment or investment strategy will be profitable. Past performance is not an indication of future results.
i Assumes that once a Six-Month Treasury matures, the proceeds could be invested at the same yield or higher to achieve the annualized return.