The previous Napatree quarterly commentary, “Divergent Paths,” illustrated that the broad stock market, most quoted as the S&P 500, generated a nearly 17% return through June 30. But under the covers, many stocks in that index performed poorly. Returns were dominated by the largest companies in the index. From the conclusion in that commentary:
Broad participation by a wide range of stocks of varying sizes and differing sectors typically bodes well for further gains, but this has not been the case. The market is at a crossroads. Either those underperformers outlined above (CVS, Johnson & Johnson et al.) “catch up” and participation expands, or the sharp gains made by the few tech companies reverse without broader contribution from other sectors, which would lead to weakness.
Unfortunately, in the past three months, the latter has been the case. Those stocks with large gains year-to-date, specifically in the Nasdaq index, sold off and the laggards didn’t play “catch-up.” The result: a summer of weak stock prices. Here are the returns of selected indexes through September 30:
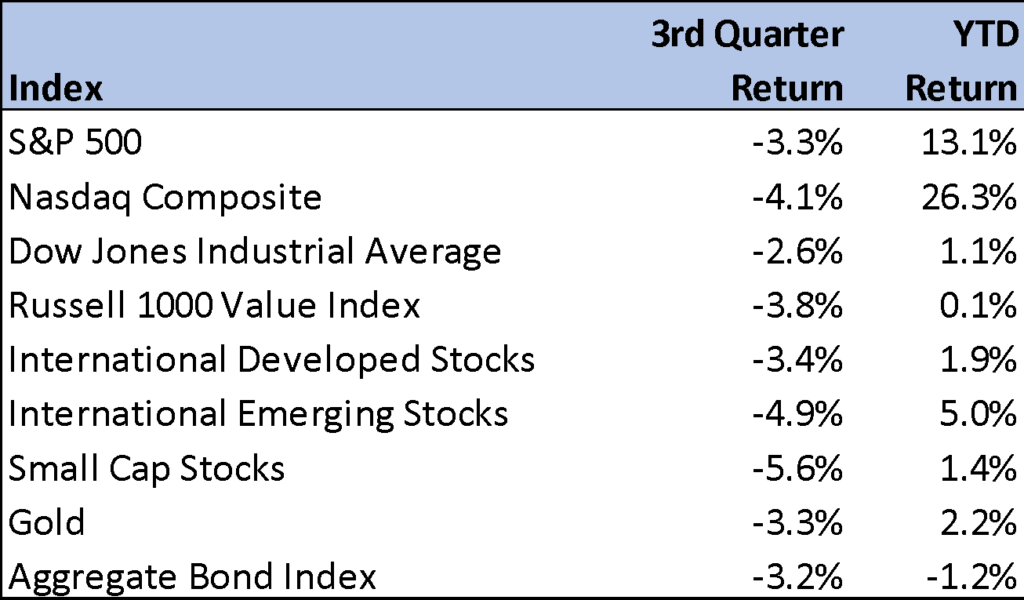
Markets have converged in the past three months, with almost every asset class producing negative returns. The quarter exhibited highly correlated price action inside a longer-term trend of lower-correlated prices for those same asset classes. For example, the Dow Jones Industrials, often referred to as the “blue chips,” produced a barely positive return through the end of September, while the Nasdaq is up 26% during that time. Since mid-July, almost every market and asset class declined in a much higher-correlated move down.
One major asset exhibiting strength in the third quarter was the US dollar, which appreciated nearly 4% (according to the ICE US Dollar Index). Movements in the dollar are dependent on many variables, because it is measured against other global currencies. During inflationary periods, however, it strengthens, as seen here (the orange line is the Consumer Price Index, a broad inflationary measure, and the purple line is the US Dollar):
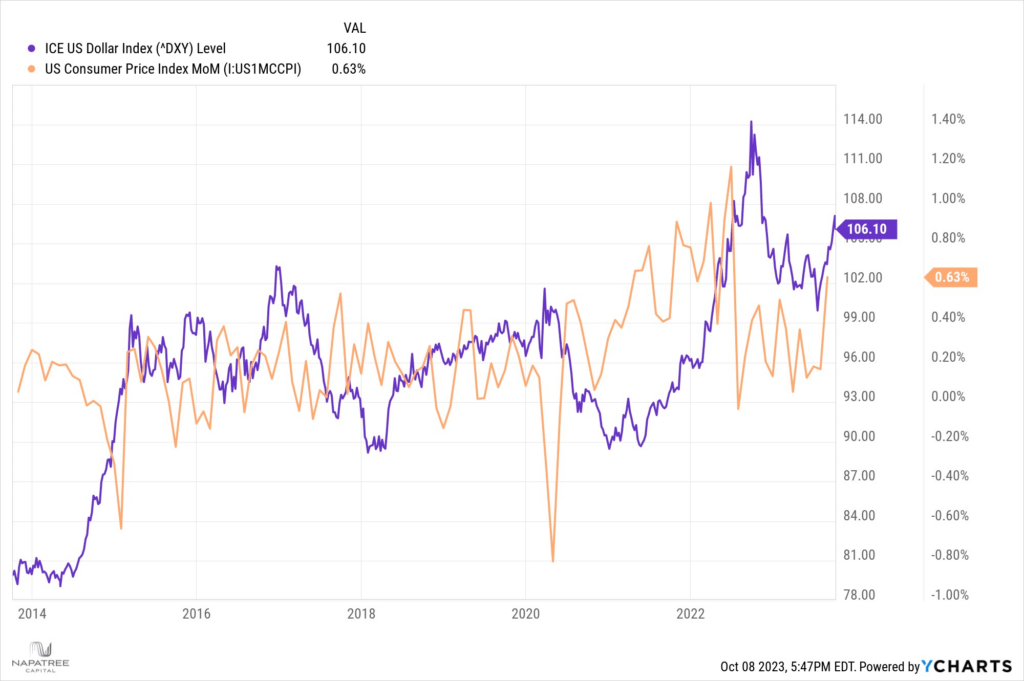
Often, such a move in the dollar also signals rising fears among investors, as the dollar is one of the safest assets in the world. A strengthening dollar compresses margins for US companies that sell products globally. Those companies convert international sales in the local currency to the US dollar, which lowers earnings margins. Lower earnings typically equal a valuation adjustment and thus a lower stock price.
The macro-economic backdrop – inflationary pressures that have caused interest rates to spike higher, and a strong US dollar – is not a sanguine environment for investors.
Bonds: A Safe Haven No Longer?
An allocation to bonds – or fixed income – is that they should provide ballast to your overall portfolio. Historically, bonds have afforded investors an income stream with a much lower risk profile than stocks. In a period of low rates, it is a challenge to generate a significant return from bonds. In anticipation of rates increasing, which negatively impacts bond prices and overall return, our approach was to invest in very short-term bonds, mostly with the backing of the US Treasury. That has served our clients well. Other money managers, with a mandate to generate higher income in bonds, were forced to chase higher yields by investing in longer-dated maturities of at least ten to thirty years. The real story – and reason – behind the difficult stock market of the past 24 months is the bond market.
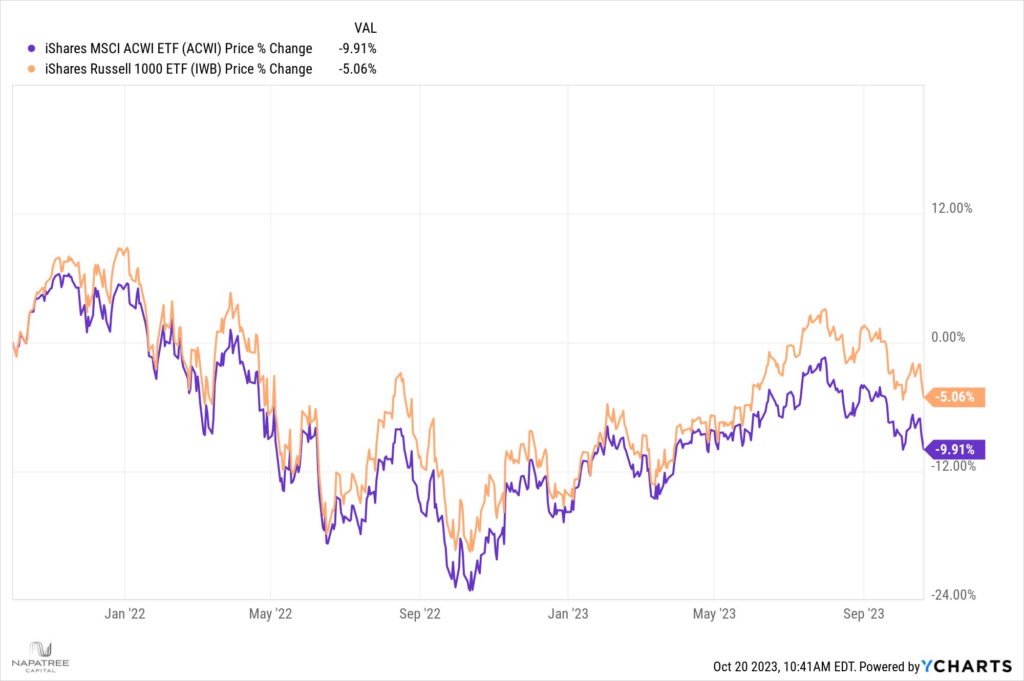
Stocks have produced negative returns for investors since October 2021. These three charts illustrate the “ride” investors have been on for the past two years:
US Stocks, of which the Russell 1000 (orange) is the broadest measure of performance, and the All-World Index (purple), as many investors use global exposure to diversify their portfolios, both showing negative returns:
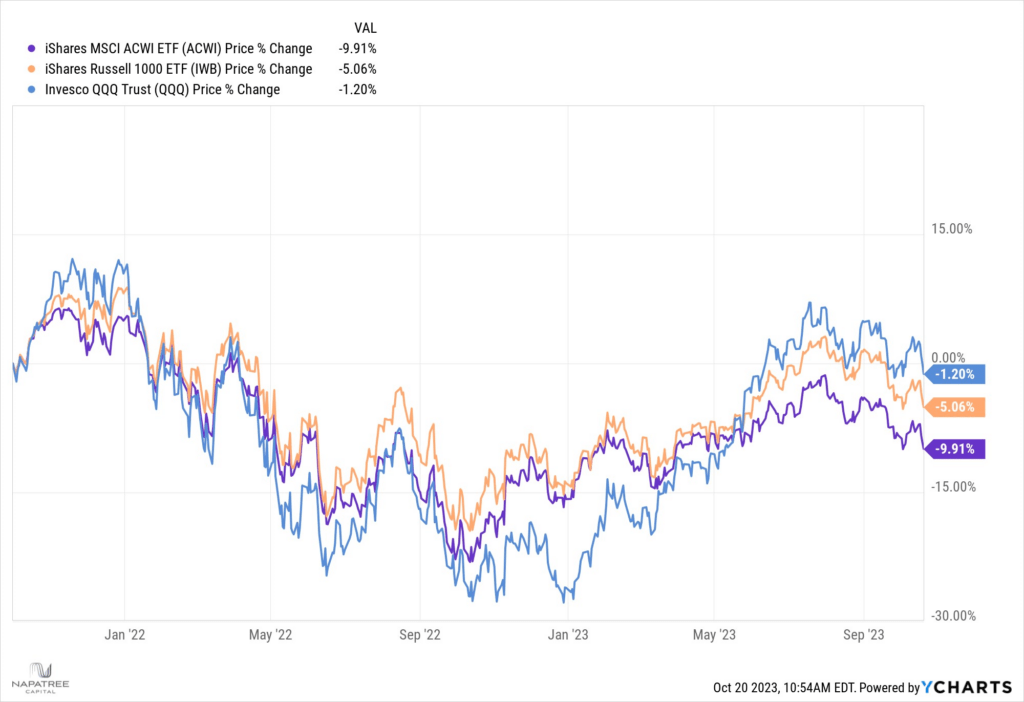
Even the Nasdaq index (measured by QQQ), red hot in 2023, has gone nowhere since October 2021.
Adding bonds with a longer maturity (TLT is a synthetic 20-year bond, blue) to the portfolio makes the investment picture dismal.
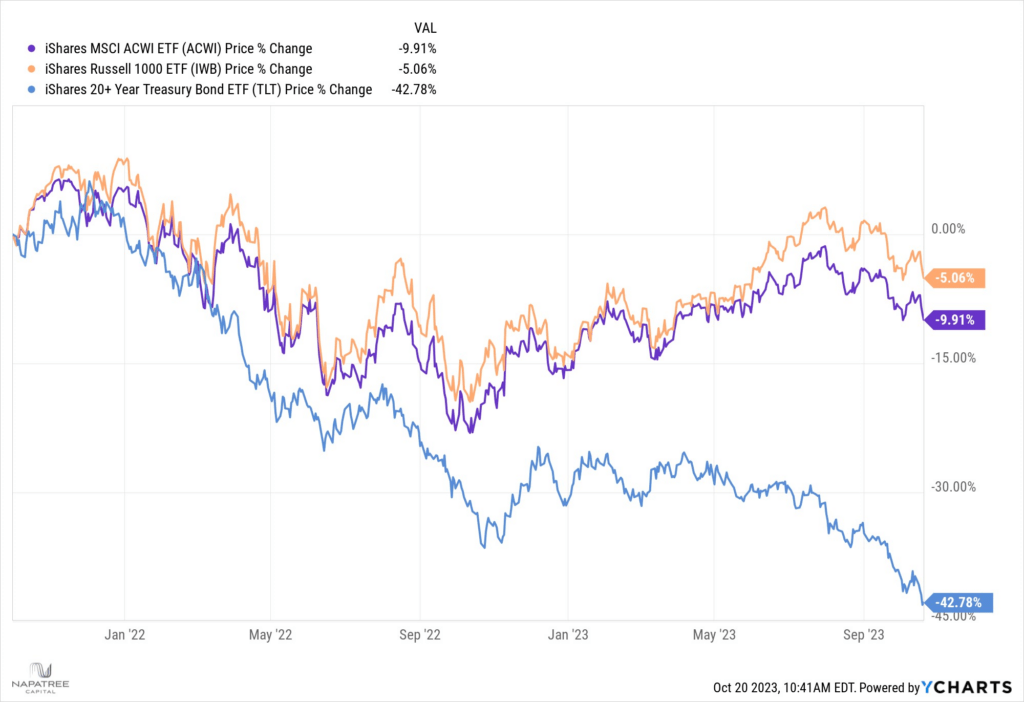
Holding long-maturity bonds has cut the value of an investor’s fixed income portfolio almost in half. And yes, if that investor holds those bonds to maturity, she is made whole as the value appreciates closer to the maturity date. Still, the effect of having a so-called “safe asset” decline so much in value is devastating to the investment psyche.
The heralded 60/40 or 70/30 portfolio, a standard for many types of investment accounts like trusts, pensions, and endowments where the portfolio is allocated primarily to stocks, and the rest to bonds, has not weathered the storm at all. Other than the meltdown from the Great Financial Crisis (GFC), where the 60/40 portfolio was down 20% in 2008 (compared to stocks down nearly 40%), last year was the worst calendar year return for that portfolio since 1974. Double digit losses are so infrequent that they have only occurred four times since 1950! This chart from JP Morgan illustrates the rarity of large drawdowns in a portfolio that is constructed to help investors withstand volatility:
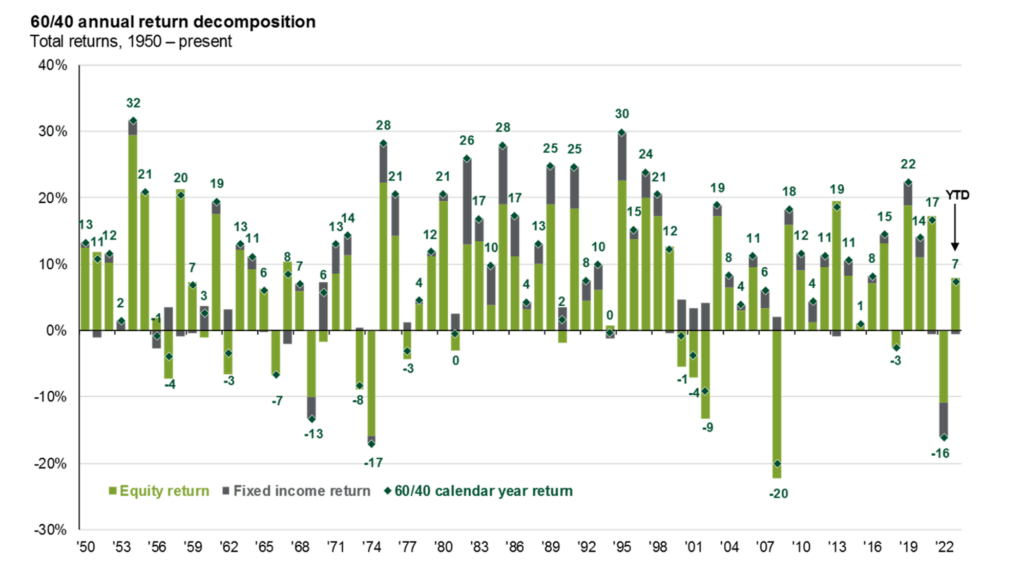
Incidentally, the 60/40 portfolio significantly outperformed an all-stock portfolio in 1974 and 2008, as the allocation to bonds dampened the negative effect of the markets. This was not the case last year and into 2023.
A Rare Opportunity
For years following the Great Financial Crisis, the discussion centered on how low interest rates were putting retirees and retirement funds at a disadvantage. For example, the lack of funding in the pension system, notably pensions for municipal workers, was a hot button economic and political issue in the 2010s. Motivated by trying to balance a municipal budget, cities and towns routinely adjusted the assumptions on forward market returns higher, to reduce the contribution amount the municipality had to make on the pensioners behalf. These actions contributed to underfunded pensions across the country, which effectively created a future liability for the city or town.
Much of investing, like life, is about common sense. Boards of pensions, and endowments, should start to see the opportunity in buying long-term bonds where the coupon payment can nearly match the liability that these funds have in terms of paying out beneficiaries. Some basic math on municipal pensions: in aggregate, they are worth $5.3 trillion in the United States, with about $334 billion in annual liabilities, or payouts to pensioners1. That equates to slightly more than a 6% spending rate on the funds2. The annual yields on 10, 20, or 30-year US Treasury bills are hovering around 5%. What does this all mean? For the first time in decades these massive funds have the potential of nearly matching the liabilities risk free, as treasuries are backed by the full faith and credit of the United States.
In periods of inflation, costs rise, as do pension payments, so 5% today is not as meaningful as 5% in 2013. But the Federal Reserve’s aggressive actions may cause inflation to begin to moderate. As interest rates trended lower for nearly four decades, there were many reports of “retirees hurt by low interest rates.” In January 2015, the Center for American Progress published an article, “The Reality of the Retirement Crisis”, outlining problems facing retirees in coming years, summarized perfectly in this statement:
..the decline in real interest rates since 1983 means that a given amount of wealth accumulated today now produces less retirement income than it would have in previous decades.
The bond market is offering an opportunity – an opportunity that could be the catalyst for a rally in fixed income markets. Because of the significance of the intermarket relationship between stocks and bonds, a better bond market with less volatility in interest rates would lead to calmer equity markets.
Looking Ahead… the “What Ifs”
What if… the Federal Reserve has effectively tamped down inflation through its dramatic measures and halts any further rate hikes? A definite positive for stocks. That would mean…
… the rapid rise in interest rates is nearing a climax. A calmer, more normalized, bond market would be a welcome change for stocks. Look for that rotation (discussed above) to spark a rally in bonds which would push yields lower.
In past cycles of Fed tightening, bonds rallied, and rates stabilized up to one year prior to the Fed halting the rate hikes, as evidenced in these three charts from Guggenheim investments:
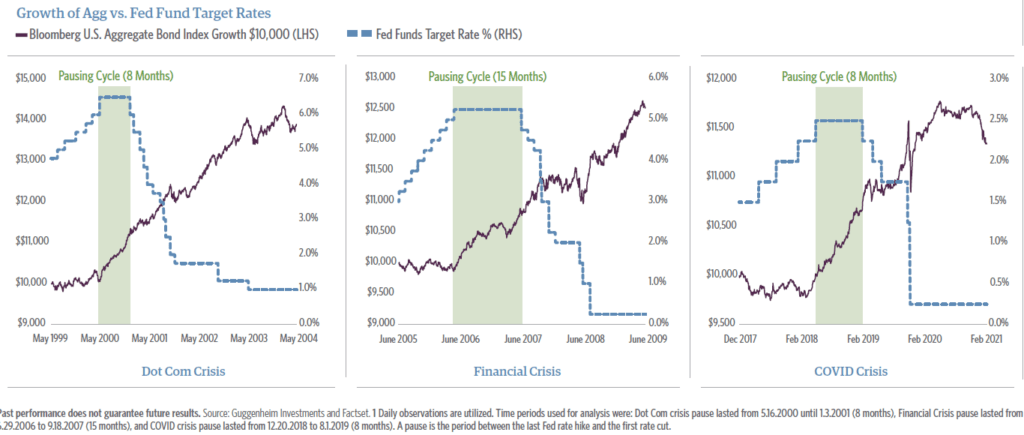
History may not repeat itself, but it certainly rhymes. Stocks performed differently for each of the periods shown, but bonds (purple line) began to rally prior to a Fed pause, driving interest rates lower.
Despite negative returns for the past two years, there is reason to be optimistic. One of the most influential scientists in the history of the world, and arguably the most important woman in science, Marie Curie, who persisted in a field dominated by men, once wrote, “I was taught the way of progress was neither swift nor easy.” Investors would be wise to heed such advice in today’s investing climate.
1 https://publicplansdata.org/quick-facts/national/
2 Each municipality has different fund levels, spending, and contributions to meet liabilities