Below is the performance of major indices through the end of September.

A few themes to highlight:
- Russell 2000, which is an index of small, public companies (small caps), has appreciated nearly 50% in the past year. We believe the strength of this segment of the market is characteristic of investors having a healthy risk appetite and should bode well for longer-term returns of all equity markets. We would, however, feel more comfortable in that assessment if those smaller company stock prices outperform the broader markets (S&P 500, Dow Jones) in Q4.
- Yield on a 10 Year US treasury “performance” is measuring the change in interest rates. The yield on the 10 Year was 0.92% at the start of 2021 and roughly 1.5% as of September 30. We believe higher interest rates are a signal of a strong economy. It is likely the most prevalent topic in financial markets going forward.
- Why are emerging markets (developing Asian economies, Latin America, Africa/Middle East) the weakest of all the major equity markets? Often higher interest rates in the US offer more attractive investment to international investors, thus moving money out of non-US dollar-denominated markets and into the US. The cause may also be the lack of vaccines and a more drawn-out process for emerging market economies to get back to normal because of the pandemic. However, we see value in emerging economies, despite the higher risk profile, and believe stronger economic trends around the globe should help propel stocks in those countries.
- Conflicting signals of inflation.
- It is undeniable that there is inflation in the global economy. Some of which is attributed to the well-documented problems in the supply chain, and some due to the combination of strong consumer demand and a shortage of labor. As stated above, this could be a reason for weaker stock prices in emerging markets and the sharp increase in interest rates. However, precious metals tend to be the beneficiary of inflation and a weaker US dollar tends to be the victim. That has not been the case in 2021 as seen by the price of gold, down 7% in this year. 2021 marks the 50-year anniversary of the United States’ official break from the gold standard – whereby dollars could be exchanged for gold. A fitting coincidence perhaps. There is also a belief that crypto currency is replacing precious metals as a store of value as bitcoin and the like generate broader adoption. (Expect a commentary on crypto soon!)
- Whatever the reason… it is odd that precious metals are losing their luster and the greenback remains strong under these economic conditions.
Nearing the End of the Covid Crisis
Covid -19 is no longer a problem. That may sound callous, but more specifically, it is no longer a problem for financial markets. Can we say that as a guarantee? Of course not. But by now hopefully you understand the way we view investing. We are continually asking the question, “What are markets pricing in?”. Based on our research and understanding of investor behavior, we believe confidently that Covid-19 as a risk factor to equity markets, and the economy, is largely in the rear-view mirror.
Analyzing infection data makes a clear argument that the pandemic is losing steam. The 7-day average of cases, hospitalizations, and deaths illustrate a spike, peak, and sharp decrease in each category. A graph of cases and hospitalizations below:
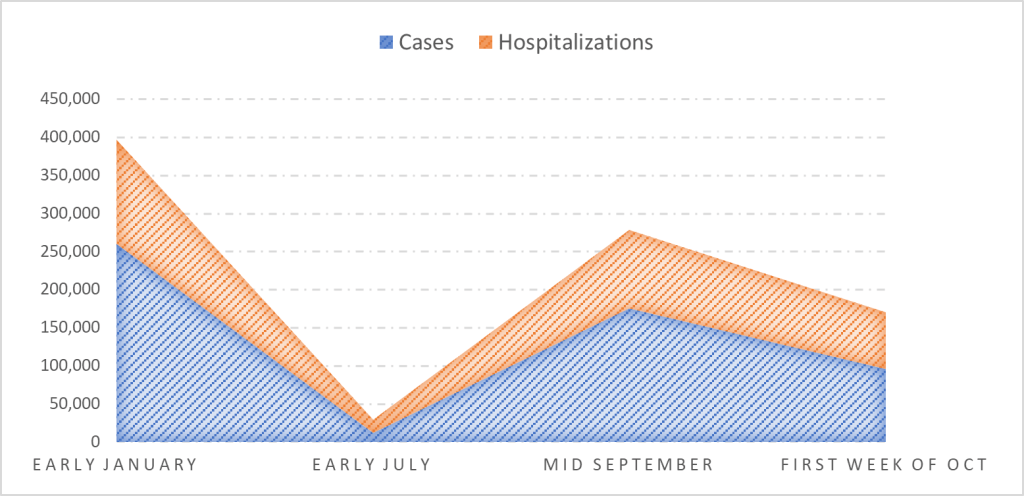
Accompanied by increasing number of vaccinations, we are slowly getting this virus under control. Our thoughts go out to anyone personally affected by the pandemic. Again, it is not to minimize the severity and devastation of the virus, simply to look at the data as a risk factor to financial markets and the economy. Consequently, the risk is minimal.
Headwinds always exist for investors. As a reminder, let’s look at the statistics related to staying invested in the market through many market cycles.
Time in the Market vs Timing the Market
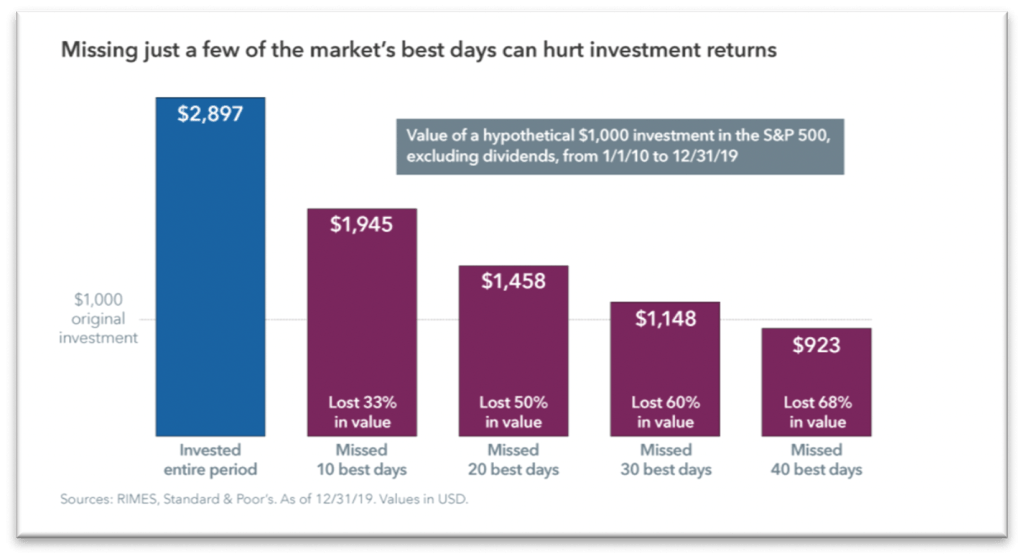
From January 1, 2010, to December 31, 2019, sitting on the sidelines at any point dramatically impacted total return on an investment portfolio. We have no way of knowing when the strongest days for stocks will occur, but missing the 20 best days in this ten-year period cost an investor a whopping 50%:
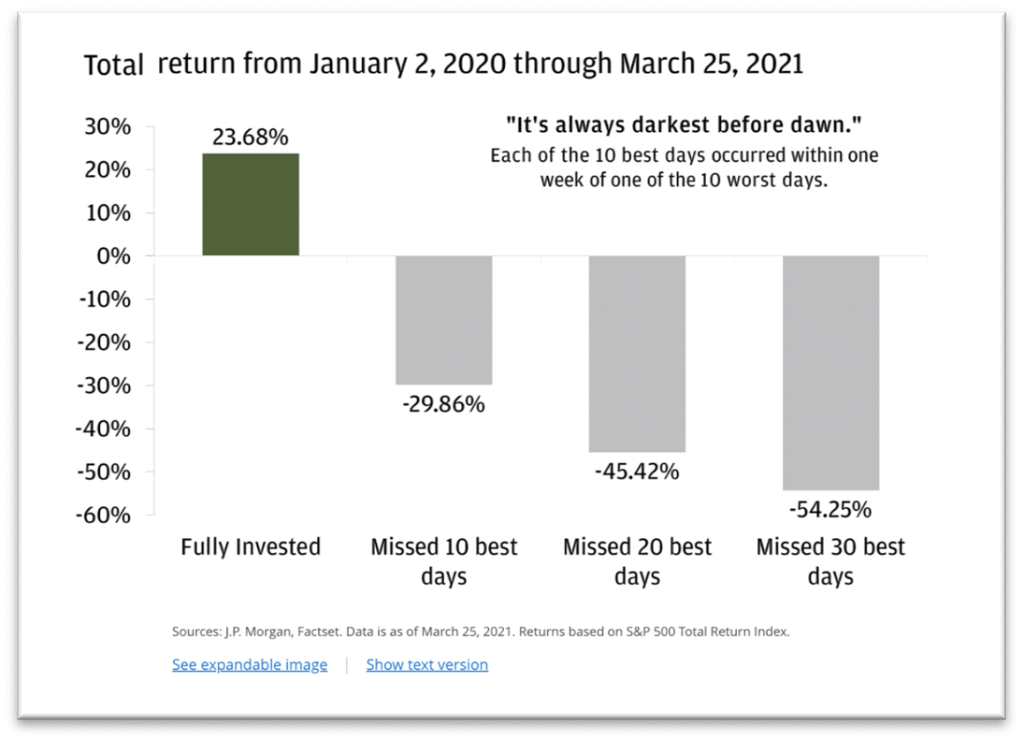
Yes, but what about the COVID crash of 2020? Let’s assume an investor decided to completely to cash at the end of 2019, thus avoiding the drastic sell-off of February and March of last year. It is highly unlikely the same investor got back invested in April, May, or even June while the pandemic was wreaking havoc across the globe.
JP Morgan published a post-mortem on investing earlier this year to examine returns (based on S&P 500 performance) based on an investor staying invested vs missing some of the best days in the market1:
The fourth quarter is historically the best performing period of any year. Looking at returns from 1953 to 2020, there have only been two instances, 1973 and 2017, where stocks sold off by more than 5% from October 1 to December 31. In 51 of the past 67 years the S&P 500 has had a positive return, averaging nearly 6% in the fourth quarter. We don’t know if 2021 will buck the trend, but our bias is to trust the data.
As always, we hope you find our commentary insightful, and we appreciate your confidence in Napatree Capital.
1 Returns through March 25, 2021. Actual returns through Q3 2021 would actually be better than illustrated.